Steps to Analyzing Locks and SpinLocks
In this blog, we will show you the steps to analyzing locks and spinlocks using windbg windows debugger.
OVERVIEW
- There are many mechanisms that Windows operating system uses to synchronize the access between multiple threads and multiple processes. The mechanisms such as locks, spinlocks, interlock instructions, Intercept request level, etc.. are used to organize thousand’s of threads running windows
- Locks are used by threads to request access to particular executive resources.
- Locks can be shared with multiple threads can read the data at same time.
- It can be exclusive, so a particular thread can update or write to a data structure without concern about other thread which is trying to updating the same thing.
LOCK REQUEST FLOW
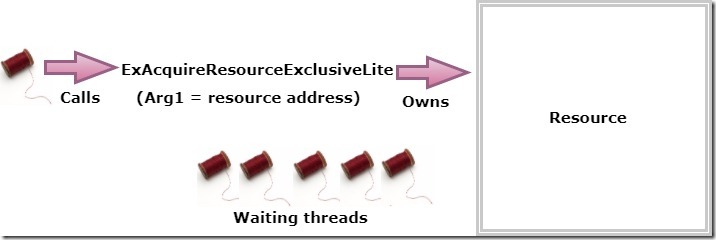
- In the above picture will explain how the locks are requested and handled by the resources.
- Here the thread calls the system function named ExAcquireResourceExclusiveLite which request the exclusive lock on a resource. The address of the resource specified as the first argument passed to the function.
- As long as there are other threads blocking this resource, the request will be granted and the thread is set to owned by the resource.
- At the later stage, other threads will request the lock to the same resource. Since the exclusive mode lock is already granted, other threads will be queued up in the waiting list.
- The waiting queue will process based on FIFO (First In First Out) fashion.
LOCKS COMMAND
- To view the resource and locked information, use !locks command in WINDBG. Also the command !locks -v <resource address> to display the threads with lock request on the resource.
- In the above output, the resource address is Resource @ 0xffffc80a11453a38 and lock type is Exclusive. The lock granted to the thread is ffffc80a12d4a080.
FINDING DEADLOCKS
- First, use the !locks command to display all the resources and corresponding locks.
- Then look for exclusively owned locks with waiter threads.
- The threads that are owned the lock on the resource will have the asterisk (*) symbol.
- use the !thread command to display the thread information that owns the exclusive lock.
- You can use the kb command to view the stack trace of the memory dump to check the waiting state thread.
SPINLOCKS
- In a multi-processor environment, spinlocks are used to synchronize the access to the common data structure.
- The way the spinlocks works is that the processor will try to acquire the spinlocks before updating the common data structure.
- So the processor who owns the spinlock will grant them access to update the data structure.
- Other processors will update until the spinlock is released.
- The problem will occur when the multiple processors are trying to acquire the same spinlock which is performing some other actions. As a result, entire system hangs.
SPINLOCKS COMMAND
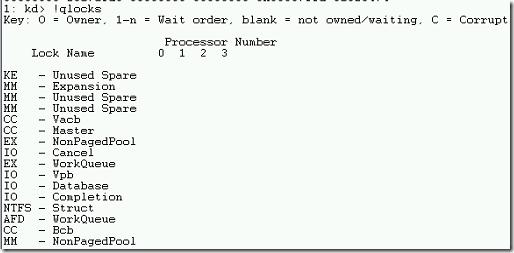
- The command !qlocks to display all kernel spinlocks and processors.
- Unfortunately, there are no spinlocks happened in the crash dump which we are using for this demo.
FINDING SPINLOCKS
- First, run the windows debugger !qlocks command to reveal main kernel spinlocks and whether they are owned by any processors.
- Then use the !running –it commands to look for the current running thread on each processor during the crash time.
- You can further investigate !thread command to examine the stack trace to find any thread is acquiring the spinlock.
- The key is to determine which driver is responsible for acquiring the spinlocks.
Thanks for reading this blog. We hope it was useful for you to learn the steps to analyze the deadlocks and spinlocks using WINDBG windows debugger.

Loges


