Steps to Analyze Windows Process and Threads using WINDBG
In this blog, we will show you the Steps to Analyze Windows Process and Threads using WINDBG windows debugger tool.
WINDOWS PROCESSES
- Processes are the fundamental blocks of windows operating system. Processes are used by Windows OS much same way till today.
- We can imagine the processes as a container for the execution of a program. Processes do not execute a program, it provides the structural and resource for underlying threads to perform the work.
- The important characteristics of windows processes as it operates in its own private address space. It allows executing a program independently without interfering other applications.
- It will have its own security context for windows processes. It also called access token for the processes.
- There are several types of processes are available for the Windows operating system They are System Process, System Support Processes, and Service Processes.
- System Process and threads are used to implement the windows operating system. It used for special kernel mode system threads operation.
- System Support Processes such as session manager, Winlogon, etc.., providing its functionality to windows operating system.
- Service processes such as the print spooler, task scheduler, etc.., are running under the system process.
- The user mode processes are used for native win32 applications and various environment sub-systems like MS-DOS, POSIX, and OS/2.
PROCESS INTERNALS
- Each process will have a unique ID also called as the Process ID (PID) to differentiate from other processes.
- Process contain smaller units called threads. Each process will have more than one threads which perform the actual work.
- It also contains handle table to index various objects like files and folders. All the threads in the process share same handle table which is maintained by the parent process.
- It also maintains the quota limits and usage information such as Limits on processor usage, paged pool, Non-paged pool, Page file usage, working set sizes, virtual size, peak virtual size.
PROCESS SCHEDULING INFORMATION
- The process will maintain the scheduling information which is inherited by the threads that are created.
- Scheduling information includes process state, base priority, CPU time slice, processor affinity.
- There are also a variety of CPU time metrics such as elapsed time, Kernel time, user time.
PROCESS COMMANDS
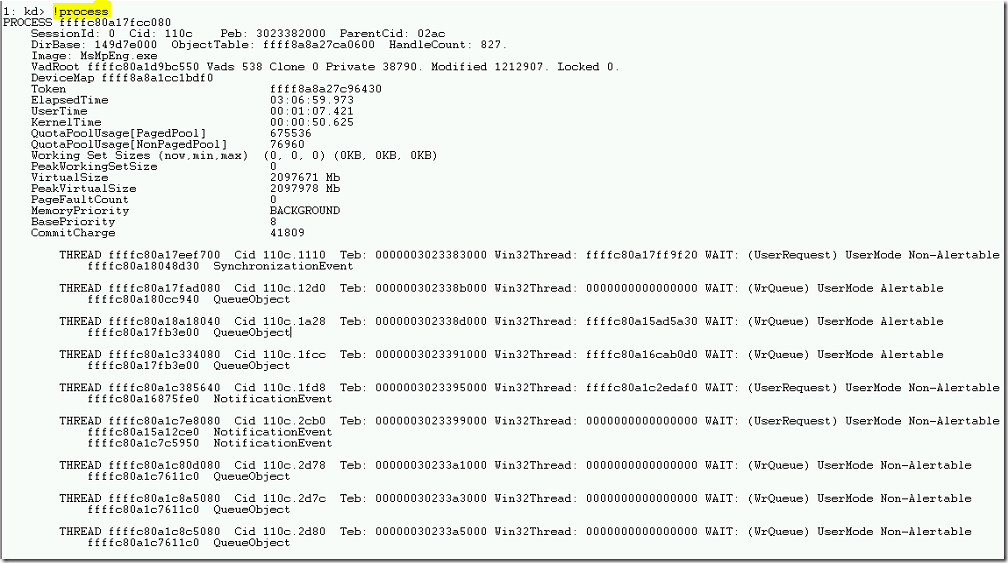
- To examine the list of the process from a memory dump using !process command in windbg windows debugger.
- It displays the variety of information such as Process ID, Image name, Handle count, CPU times (elapsed, kernel, user), Quotas & usage (pool, working set, virtual address space), priority, Threads.
- The command syntax is !process <process address> <flag>.
- To display the current process during the system crash, type !process.
- Examples of !process command
!process – Display current process
!process 0 0 – In brief mode
!process 0 7 – In full mode
!process ffffc80a16f19540 – Information about particular process
WINDOWS THREADS
- A thread is a part of a process that actually scheduled to execute a program.
- Every thread will receive a unique thread ID which differentiates other threads from the system.
- A process can have more than one thread(s).
- There will be 2 stacks per thread. They are user-mode & kernel-mode.
- It shares same virtual address space of a parent process. This allows the multiple threads that share common data structure in the memory. Also, it shares same security token.
- Each thread shares the process handle table which allows the thread to access the objects such as files and folders.
THREAD INFORMATION
- Each thread will have start address which contains the function information that calls when the thread initially started.
- It also contains information about which process is responsible for creating this thread.
- Thread data structure also maintains a list of pending I/O requests that are not completed.
- Thread also contains a pointer to system service dispatch table which is used in kernel mode when a thread executes the system service.
- It contains scheduled information inherited from the parent process.
SYSTEM THREADS
- The system threads which runs under system process.
- System Threads runs only in kernel mode and is responsible for the majority of kernel mode threads.
- It used to the NT Kernel and device drivers to perform its work.
- It uses the system address space and they do not have the access to process address space.
IDLE THREAD
- An idle thread runs when no other runnable threads need the CPU.
- It runs under base priority 0.
- There will be only one idle thread per processor.
- Also, there will be only one idle process for all idle threads.
- The main thing the idle thread does is loops to itself in a function called nt!kidleLoop.
- Idle threads also check for expired Deferred Procedure Calls (DPC).
THREAD COMMANDS
- To view the thread related information using !thread command. It contains Thread ID, State (Running, Wait or Terminated), Image name, Owing Process, Stack base, current, limit, CPU times, priority, Stack trace.
- The syntax is !thread <Thread Address> <options>
Options :
0 – Brief Details
6 – Full Details
- To display the current thread, Type !thread command.
“Note: Use !stacks command to display all threads and their stack trace.
- To view information about a particular thread, type !thread <thread ID>
Example : !thread ffffc80a11a7f700
VIDEO
Thanks for reading this blog. We hope it was useful for us to learn to view process and thread information using WINDBG tool.

Loges


