Zabbix Agent Installation and Configuration Guide on FreeBSD 12.0
Zabbix is an open-source monitoring software tool for diverse IT components, including networks, servers, virtual machines (VMs) and cloud services. It provides monitoring metrics, among others network utilization, CPU load and disk space consumption. This monitoring configuration can be done using XML based templates which contain elements to monitor.
In this guide, we are going to see zabbix agent installation and it’s configuration in FreeBSD12.0 operating system. This guide will help many freebsd users to monitor their machines via zabbix monitoring system. Here we are going to install zabbix-agent v4.0.25 from different ways which are listed below,
Installing from ports collection
Before proceeding with installation, make sure that your ports tree collection is up to date by running the below command, # portsnap update
Or # portsnap fetch # portsnap extract
Then, navigate to port directory “/usr/ports/net-mgmt/zabbix4-agent/” and run the command ‘make install’ to install only the agent.
Installing from packages
# pkg install zabbix4-agent
Above command will install the latest the version of package.
In both installation procedures, a zabbix user and a zabbix group will get created automatically. Once the installation completes, you can able to see the configuration files at /usr/local/etc/zabbix4 directory. If there is any problem in installing it via package distribution, directly download the binary file from the below git link and install it by using the below commands # fetch https://gitlab.com/freebsd1/zabbix-agent/-/blob/master/zabbix4-agent-4.0.25.txz # pkg add zabbix4-agent-4.0.25.txz
Configuring Zabbix4-agent
After the installation is complete, next part is to configure the zabbix agent to communicate with the zabbix server and to enable the log file.
Here are the two things that will create at /usr/local/etc/zabbix4
- conf.sample – Sample agent configuration file. From which zabbix agent configuration file can be copied from here or a new file can be created.
- conf.d/ – It is a directory to store the custom user parameters required for the zabbix templates. But it has to be enabled in the configuration file as include parameter.
Main parameters required for zabbix agent configuration is listed below,
- Server => Need to provide zabbix server IP along with subnet.
- ServerActive => Need to provide zabbix server IP for active check.
- LogFile => path for the zabbix agent log file.
- HostnameItem=system.hostname => Don’t change the value for this parameter. This will use the system hostname as the hostname value when adding host in zabbix server.
- Include => Enable this parameter with the value *.conf , so that custom user parameters can be mentioned in that conf file.
- Timeout => It is optional. If you are using any scripts to get the values for key item then it should be enabled. By default timeout is 3 seconds for processing scripts.
Example values are listed below:
LogFile=/var/log/zabbix_agentd.log
Server=x.x.x.x/24
ServerActive=x.x.x.x
HostnameItem=system.hostname
Include=/usr/local/etc/zabbix4/zabbix_agentd.conf.d/*.conf
Timeout=20
Now to start the zabbix agent service, issue the below command in the terminal and to start the service automatically at the boot time, # sysrc zabbix_agentd_enable=YES # service zabbix_agentd start
Note: If you want to run the agent service as a zabbix user, change the user and group ownership to zabbix for /usr/local/etc/zabbix4 . Also, change ownership for the log file too.
From different git sources, I have collected useful zabbix templates for FreeBSD and also written a script to install the agent and to configure it automatically. To do so, clone this git repo and run the zabbix_agent.sh script to make your job simple.
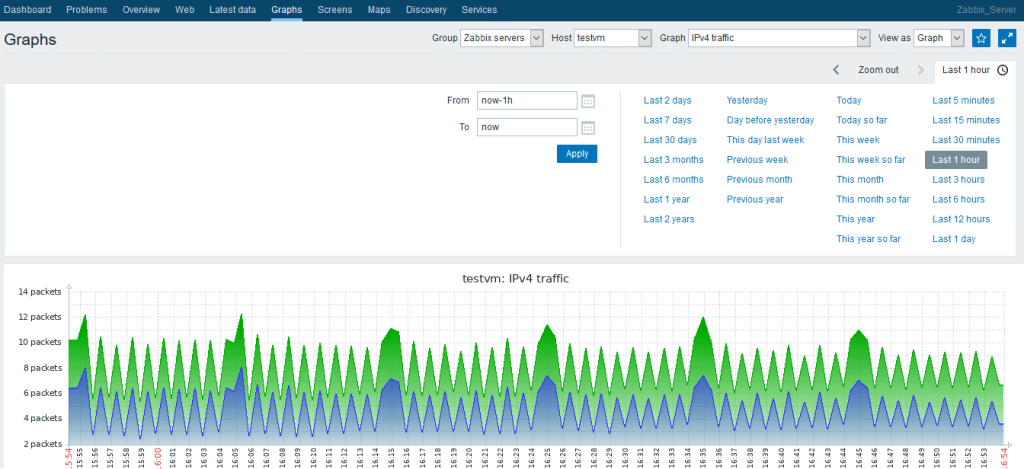
- IPv4 and IPv6 Statistics
By using this template, can monitor the ipv4 and ipv6 network statistics report in a graphical format.
Template File => FreeBSD_IP_statistics.xml
Conf File => IP_Stats.conf
Source: https://share.zabbix.com/operating-systems/freebsd/ip-utilisation
- Disk Statistics
By using this template, we can monitor all the disks utilization and the read/write speed in a graphical format.
Template File => iostat-template.xml
Conf File => iostat.conf
External scripts => iostat-collect.sh , iostat-parse.sh
Source: https://github.com/zzzevaka/zabbix-freebsd-iostat
- ZFS Statistics
By using this template, we can monitor the zfs dataset usage, vdev errors, read and write and zpool usage & health status in a graphical format.
Template File => zfs_template.xml
Conf File => zfs.conf
External scripts => zpool_health.sh
Source: https://share.zabbix.com/operating-systems/linux/zfs-on-linux
Note: Additionally added an external script which helps to display the pool health status in the graph.
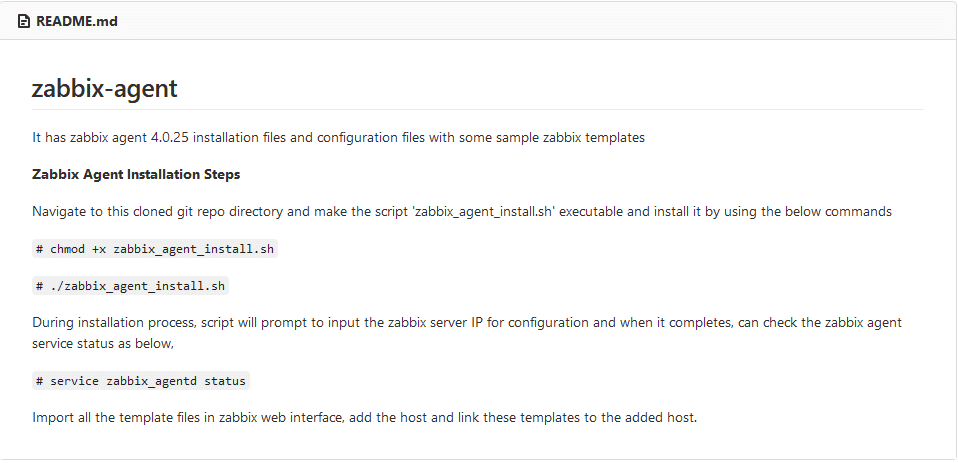
Download the template files along with the zabbix agent binary file from this git repo https://gitlab.com/freebsd1/zabbix-agent . There is an installation script ‘zabbix_agent_install.sh’ to make the user job easier in installing and configuring the agent. Please go through the README file for the installation instructions.
Below steps are to be followed in Zabbix web interface in order to do the following:
- Importing Templates.
- Creating/Adding a New Host.
- Link a Template to the Host.
Let’s see the above topics in detail
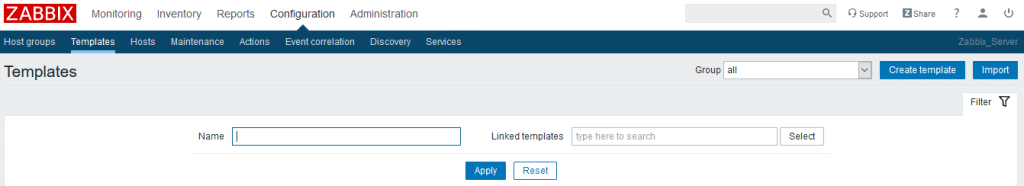
Importing Templates
All the templates provided in the git link can be imported to the zabbix server by navigating to the following menu,
Configuration -> Templates -> Click ‘Import’ Button
Then choose the template file and click import.
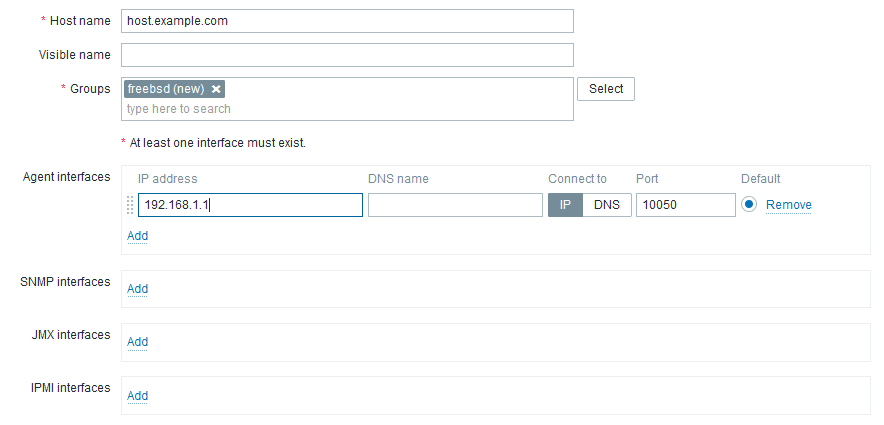
Creating/Adding a New Host
To do this, navigate to the menu,
Configuration -> Hosts -> Create Host .
Here in Hostname field, should provide system hostname, in groups field can provide anything, also you can create your own group and in agent interface field should provide the IP address of the host and then click ‘Add’ button.
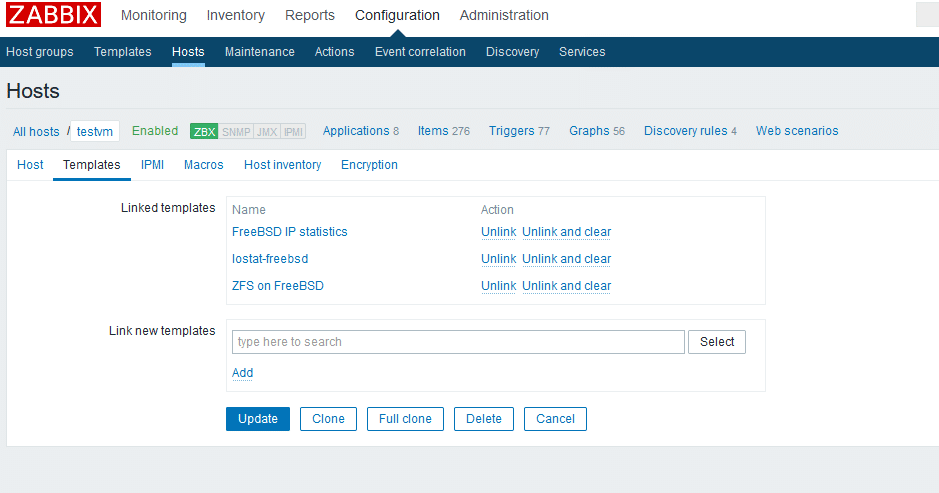
Link a Template to the Host
Once the host is added, can link the one or more templates to that host at,
Configuration -> Hosts -> Click the Added New Host (host.example.com) -> Templates
Here type the template name ‘iostat-freebsd’ in the ‘Link New Templates’ field, select and add that template which should be displayed in ‘Linked Templates’ section as shown below and then click ‘Update’.
For zfs template, there are some more things to be configured in the web interface like creating ‘Regular Expressions’ and ‘Value Mapping’. Create the new regular expressions as shown below:
Create Regular Expression
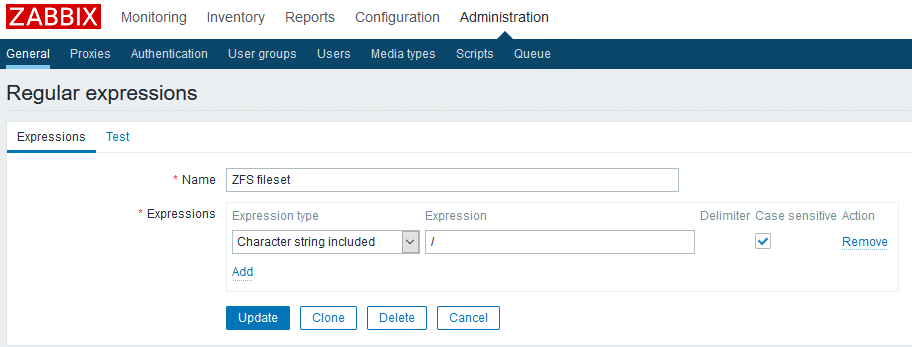
Navigate to Administration -> General -> Regular Expressions(choose from the dropdown) and have to create two regular expressions as shown in the below pics,
“ZFS fileset”
Expression type: Character string included
Expression: /
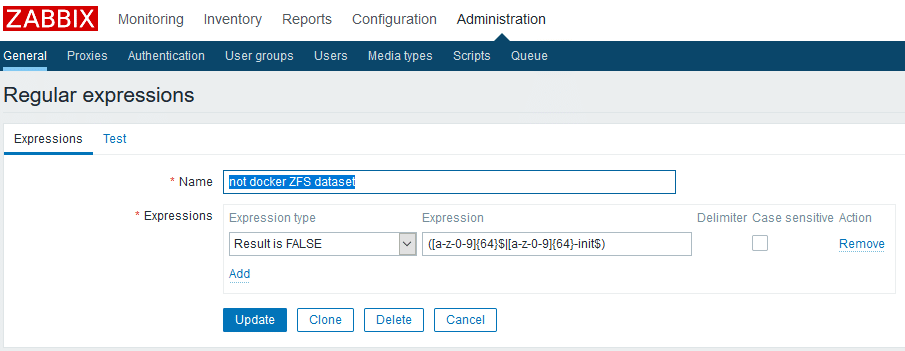
“not docker ZFS dataset”
Expression type: Result is FALSE
Expression: ([a-z-0-9]{64}$|[a-z-0-9]{64}-init$)
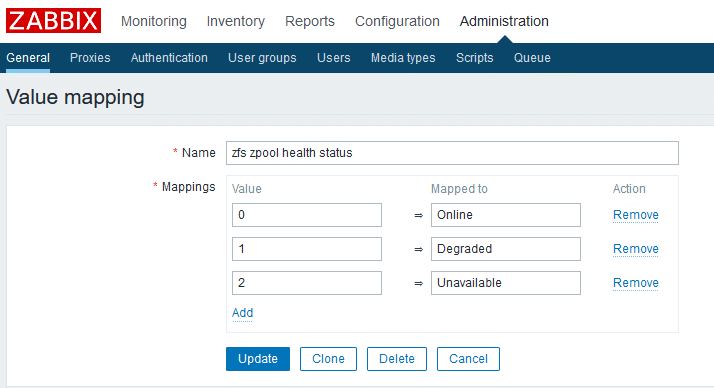
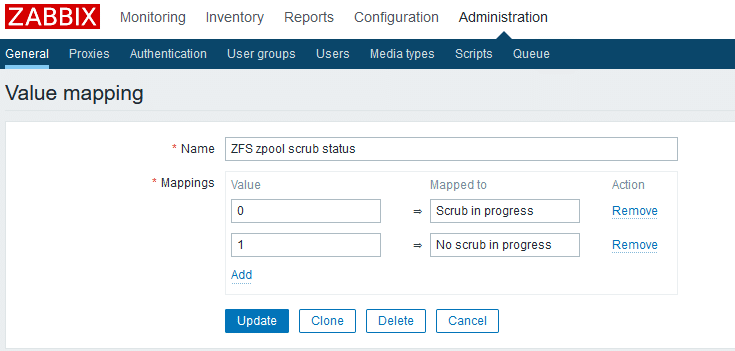
Create Value Mapping
Navigate to Administration -> General -> Value Mapping(choose from the dropdown) and have to create two value mapping as shown in the below pics,
Once everything is done and depending on the zabbix templates added, after few minutes host information will get collected and can be viewed at,
Monitoring -> Graphs
If there is any error in the vdev or if the pool is not online, you can see the alert generated at the Dashboard and the dashboard view can be edited according to the user need.

Senthilnathan