Analyzing crash dump using windows debugger windbg – RESOURCE_NOT_OWNED (e3)
In this blog, we will show you the steps to Analyzing crash dump using windows debugger windbg – RESOURCE_NOT_OWNED (e3).
REQUIREMENTS
- Windows VM
- Windows Debugger – Windbg
- Dump file for analysis – Memory.dmp
OVERVIEW
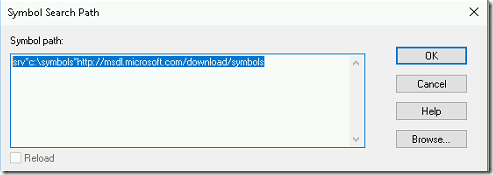
- Before analyzing the crash dump, make sure that symbol file path is pointing to Microsoft symbol server.
- The default path for memory dump file is C:\windows\memory.dmp
- !analyze –v is the first debugger command that will be executed while analyzing the crash dump. It’s the most important command in the debugger.
- It performs the preliminary analysis of the memory dump also it provides details to begin our analysis.
- This command will display the stop code and type of bug check it occurred with the symbolic name. Also, it provides the explanation of the crash type.
- It shows the stack trace help us to determine the commands which lead to the crash.
- Also, it displays Faulting IP, Process & Registers
- The command will provide the recommendations to resolve this issue.
Note : In this demo, we are using the windows 10 crash dump file for analysis.
LOADING THE DUMP FILE
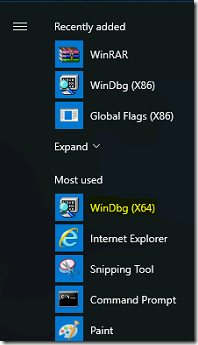
- Go-to start menu and click on Windbg (x64).
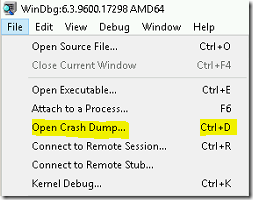
- We have already copied the windows 10 memory dump file in C:\ drive for the demo purpose. Click on the File menu and select Open Crash Dump.
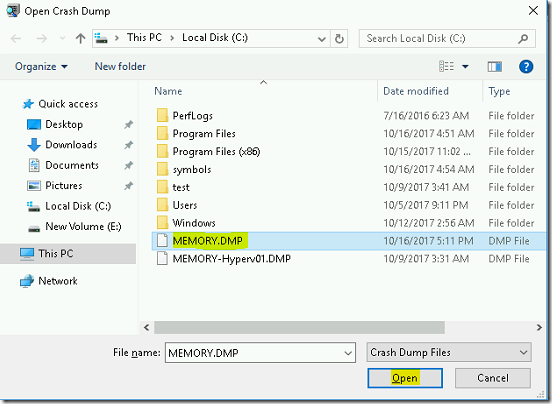
- Select the Memory.dmp file and Click on Open.
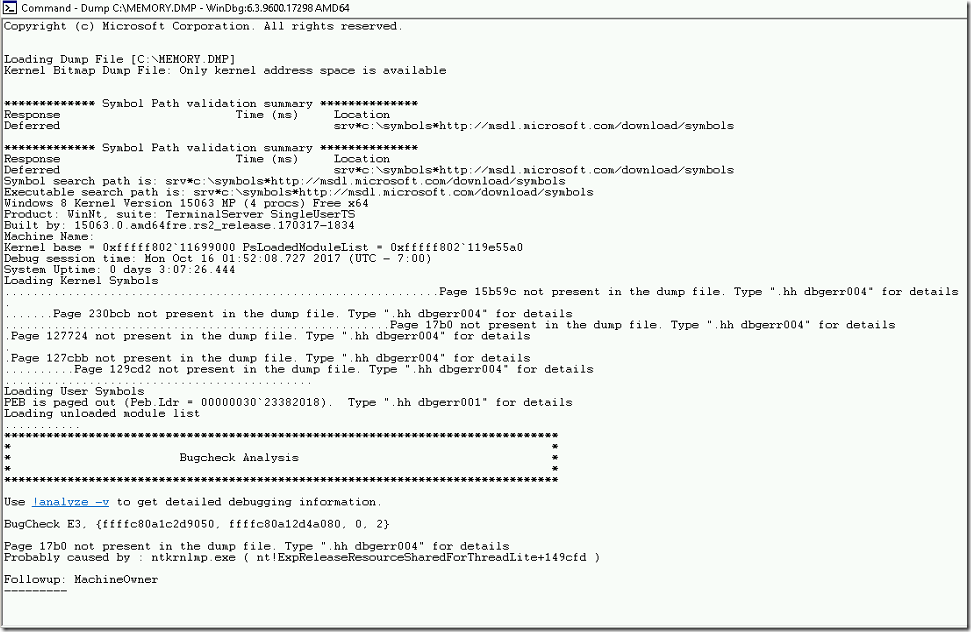
- It loads the Microsoft symbol and displays the first set of information as shown in below image.
- First, it loads the memory.dmp file then it loads the Microsoft symbols to analyze this dump. Also, it displays the OS version and built details.
Note : As we are using the windows 10 memory dump, windbg is detects the OS type as Windows 8. We are not sure why it is
- It also shows the Architecture type, crashed date and time, system uptime.
- It provides the stop code along with parameters as E3, {ffffc80a1c2d9050, ffffc80a12d4a080, 0, 2}
- This crash was caused by ntkrnlmp.exe.
- Also, suggests us to run !analyze -v to get more information.
ANALYZING THE DUMP
- Type the command !analyze -v in KD prompt and press Enter.
Note : The number 1 shows in the KD prompts indicates that crashed occured on CPU 1.
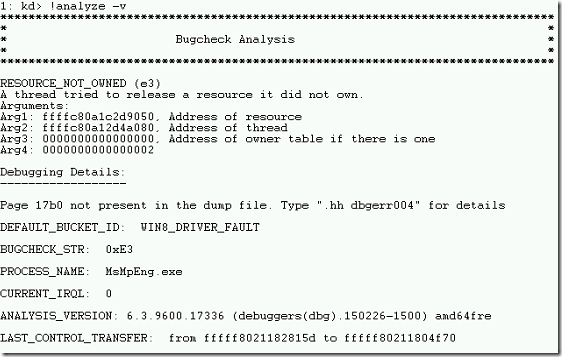
- It displays detailed information about the crash dump as shown below.
- It shows the bug check type is RESOURCE_NOT_OWNED (e3).
- Also, there are various arguments related to this crash.
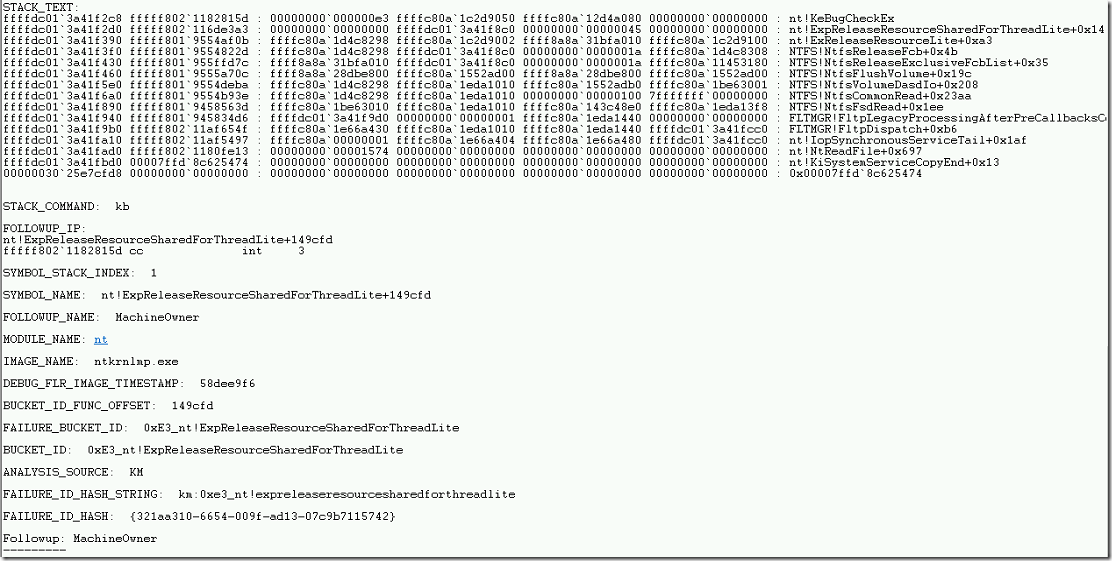
- We can also find the stack trace for this crash dump.
- The stack trace will show the history of drivers that are executed during the incident occur. In the above trace, it shows NTFS, NT & FLTMGR drivers loaded were executed during that time.
- In addition to the stack information, the FOLLOWUP IP address shows the command that was executed before bug check.
- Then it shows the name of the driver that it believed to cause the crash. In this demo, it shows ntkrnlmp.exe
FINDING THE SOLUTION USING CLUES
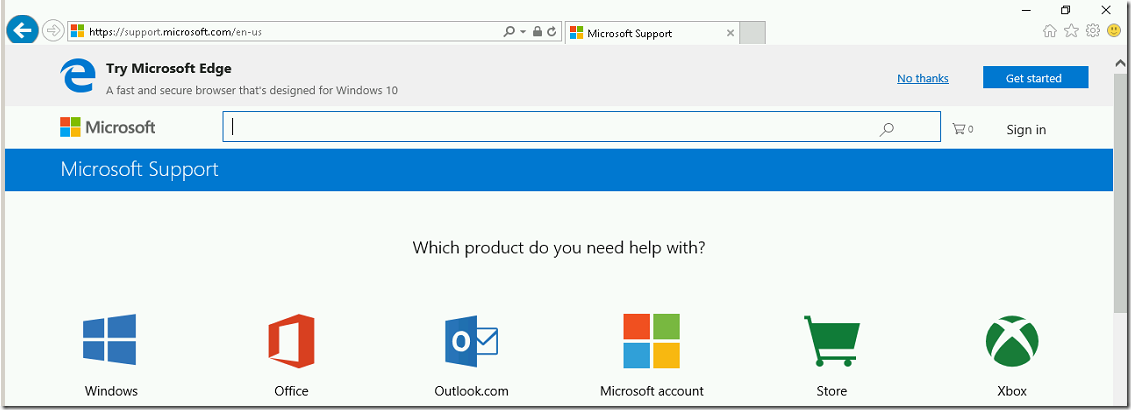
- Go to the Microsoft Support URL http://support.microsoft.com from the web browser.
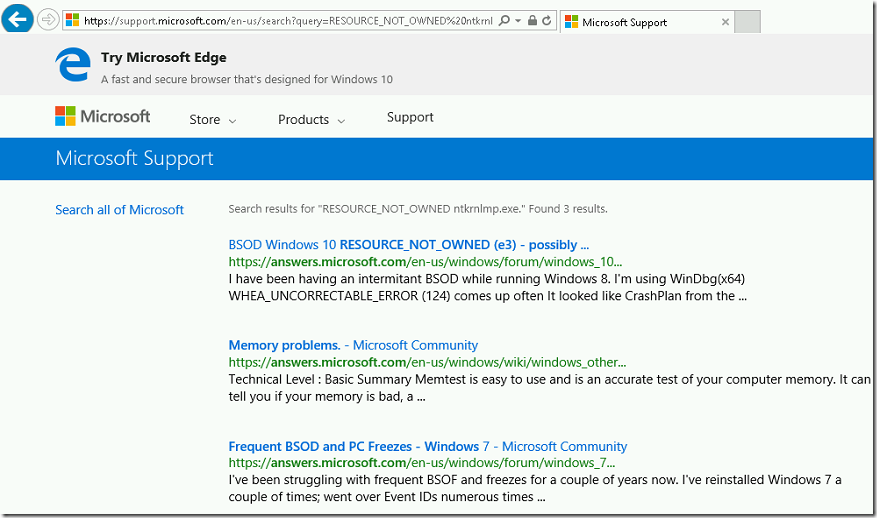
- In the search window, type the ERROR CODE CLUE and the process name. In the demo, we found RESOURCE_NOT_OWNED and ntkrnlmp.exe these clues from the crash dump. Type these in the search box.
- It shows few results matched to this error code.
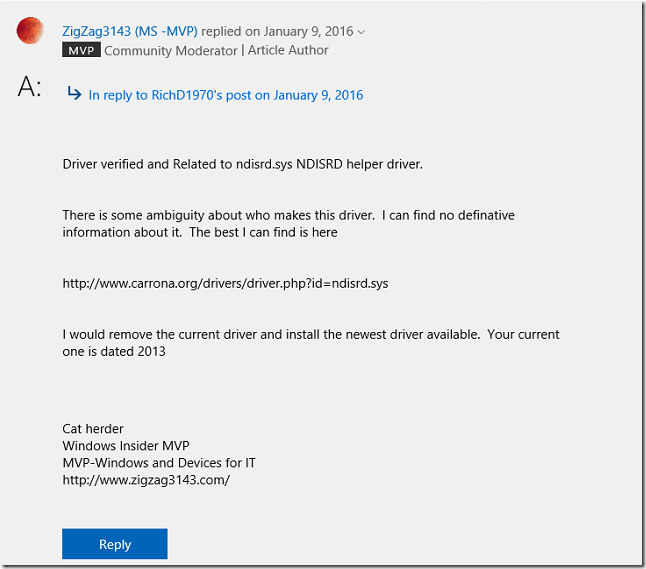
- We checked the first URL (https://answers.microsoft.com/en-us/windows/forum/windows_10-performance/bsod-windows-10-resourcenotowned-e3-possibly/2becee06-d91b-494d-80ee-2b5fab3eaa3d) and found that issue was caused due to network card driver.
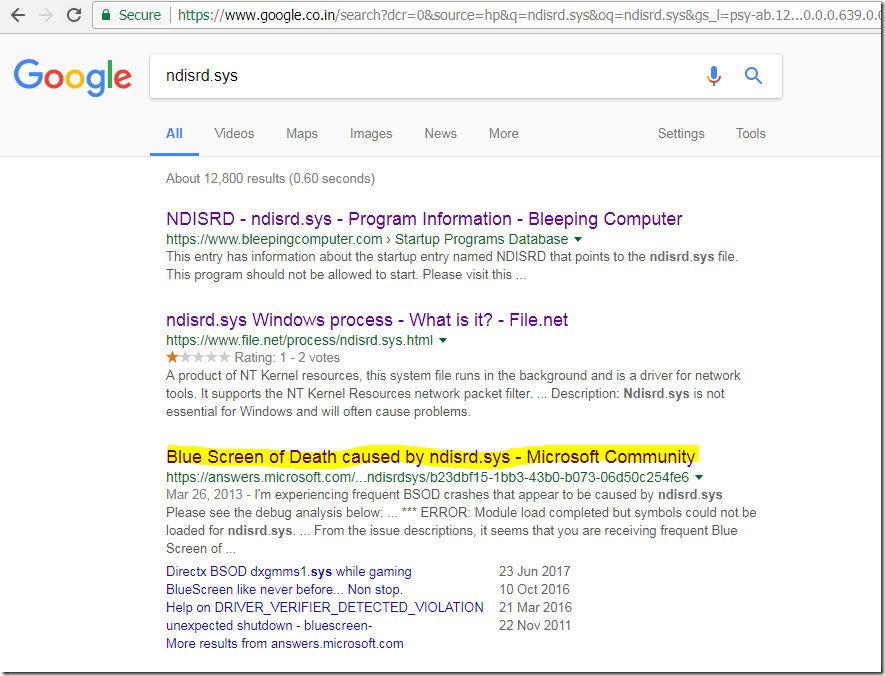
- Then we search only the drive name ndisrd.sys and found the Microsoft URL (https://answers.microsoft.com/en-us/windows/forum/all/blue-screen-of-death-caused-by-ndisrdsys/b23dbf15-1bb3-43b0-b073-06d50c254fe6)
- We have updated the Realtek network card driver to latest version and machine was stable without BSOD.
VIDEO
Thanks for reading this blog. We hope it was useful for you to learn to analyze the crash dump using windows debugger tool.

Loges

