Windows Stack Trace Fundamentals
In this blog, we will explain you in detail about windows stack trace fundamentals in windows debugger.
STACK – DEFINITION
- The stack is a fundamental data structure used in computer programming. It can be used by the developer to write applications.
- The primary use of stack by an operating system is to keep track of function calls and parameters.
- The stack can also be used to provide a temporary storage area for local variables as functions execute.
- It used to perform various string manipulation and various expressions.
HOW STACK WORKS
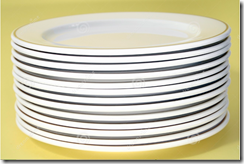
- For example, think about cafeteria plates. The first plate placed at the bottom of the stack. New plates added (or) pushed on top of the stack. So stack group from bottom to up.
- Old plates can be popped off the top of the stack which makes the stack to shrink.
- The stack maintained LIFO (Last In / First Out) ordering. To access the plates at the bottom of the stack, need to poped of all the plates above that plate.
- The Operating System like windows will use the stack to keep track which functions are executed.
- The top of the stack is maintained by the Hardware Register. It’s called as Stack Pointer.
- The stack pointer contains the memory address of the top of the stack.
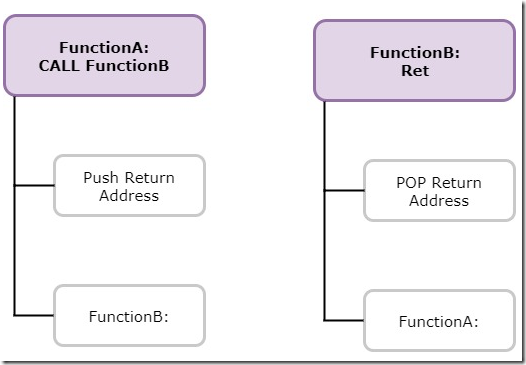
- Whenever a CALL instruction is used to execute a function the RETURN address of calling function is placed on the stack.
- The last instruction in a function is called RET (or) RETURN instruction. It’s used to POP the return address on the top of the stack.
- In the above example, FunctionA which makes a call to FunctionB. Before executing the code in FunctionB, CALL instruction PUSH the return address of FunctionA on the stack.
- After FunctionB is executed, It issues a RET instruction, which POP the return address of the stack. It continues to execute from where it left at FunctionA.
STACK TRACE – DEFINITION
- A stack trace provides the history of function calls which made by a particular thread as it executes.
- It provides exact information about thread history and crashes information. In this way, we can review the system crash what was occurred before the system failed.
- Stack trace develops from bottom to top. When the thread calls a function, the return address of the current function is placed on the stack. The bottom of the stack contains an initial function that was called.
- The address on the top of the stack trace is the most recent functions.
WINDOWS STACK
- The windows operating system implements 2 stacks Per thread. They are User Mode stack and Kernel Mode stack.
- The user mode stack size is 1 MB of size and it’s pageable.
- Kernel mode stack size is 12 KB and it’s not pageable.
- User stack is used by a thread to call various user mode functions. For example, W the en call was initiated to the system service, operating system switches to kernel stack to execute the function. When the function is finished, OS switches back to user stack.
- The windows OS also maintains the DPC (Deferred Procedure Call) Stack. This allows drivers to execute some work the at the lower request level. So that the processor will free up for high priority work. Each processor will have its own DPC stack.
EXAMPLE STACK TRACE
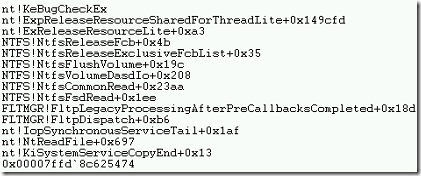
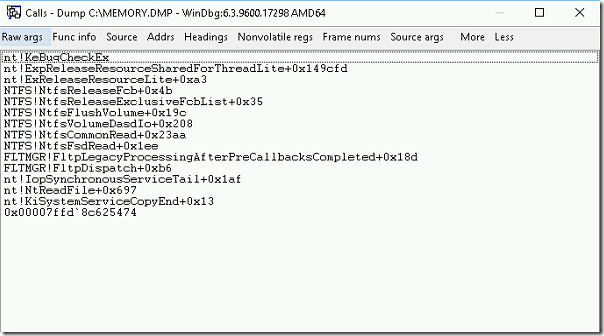
- In the above example stack trace, there are references and functions that are involved in the startup a thread. 0x00007ffd`8c625474 is the initial function call in a stack.
- For every function, there will be name before and after the exclamation mark. The name before exclamation mark is the name of a driver or OS component that provides the function.
- The name after the exclamation mark is the name of the function itself.
- For example, if we take the NTFS!NtfsFsdRead+0x1ee, where the function NtfsFsdRead inside ntfs.sys driver. In summary, ntfs.sys driver use the function ntfsFSdRead to perform read operation.
ACCESSING STACK TRACE IN WINDBG
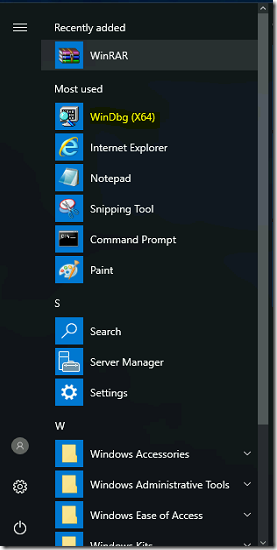
- Click on Start Menu and select WinDbg (x64).
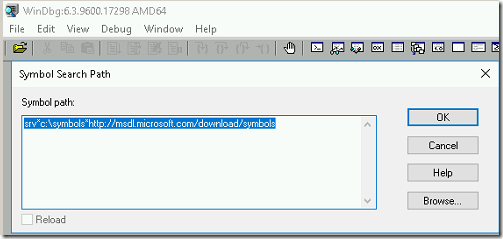
- Make sure the symbol path is pointing to Microsoft symbol server.
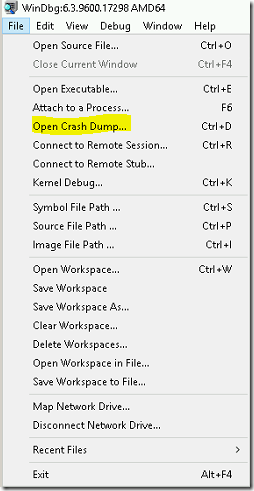
- Click on the Open crash dump from the file menu and select the dump file.
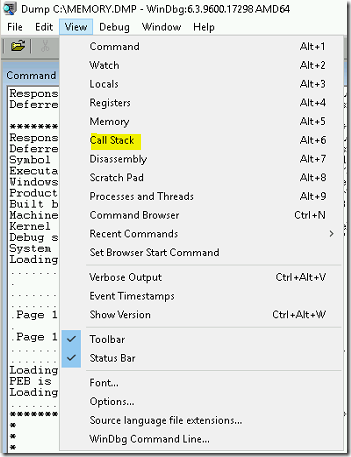
- Select View menu and click on call stack option.
- It will open a new window as shown below.
- We can customize the display by adding the arguments like Raw args which display the hexadecimal numbers on left side of function names.
- There are other parameters like Func info, Source, Addrs, Headings, Nonvolatile regs, Frame nums, source args to customize the stack trace information.
VIDEO
Thanks for reading this blog. We hope it was useful for you to learn the basic fundamentals about stack trace.

Loges

